
Map Gallery

Juneau Landslide Potential Index (LPI) map. This map was created by combining several different elements (e.g. prevailing winds, slope, landcover, slope orientation, and more) into an equation and running the equation over known landslides in Sitka and Ketchikan, AK. This helped to 'train' the equation on where landslides are likely to occur. It was kind of a rough machine learning technique. The trained equation was then run across Juneau where there was a gap in the dataset of known landslides at the time of this project.

3D view looking east towards Juneau. It shows landslide potential where darker reds indicate a higher potential for landslides and greens a lower potential.
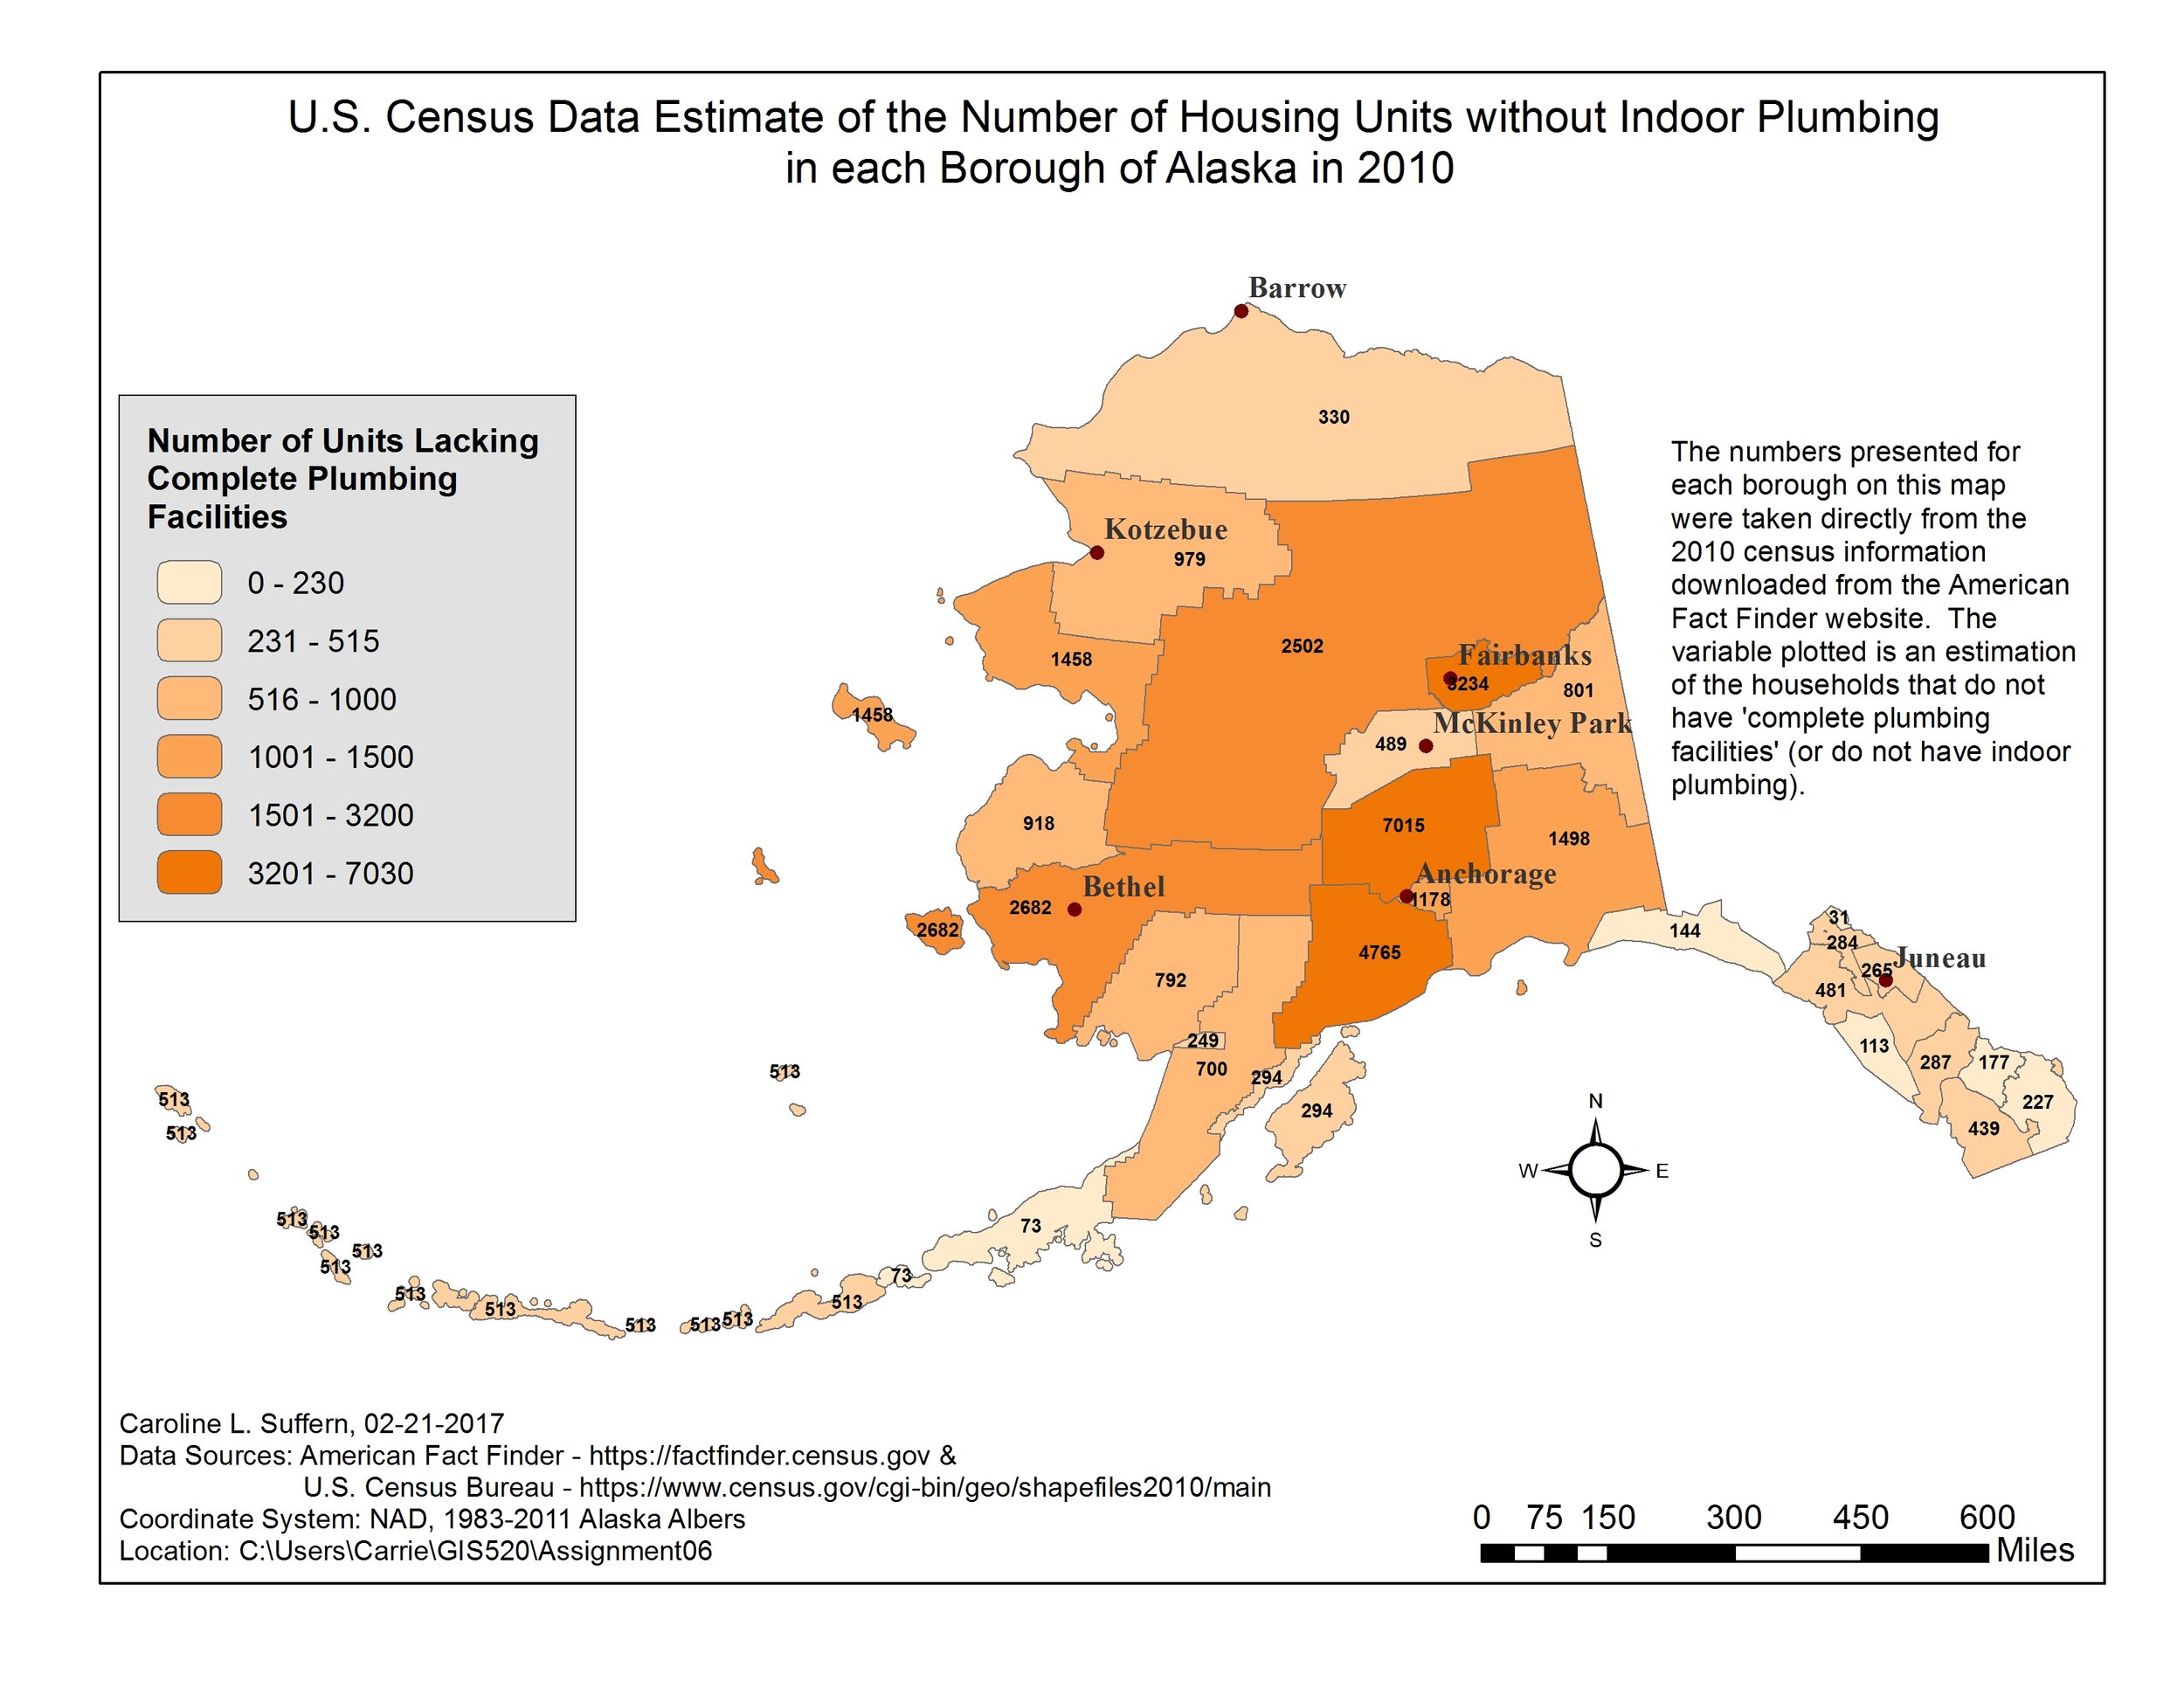
Using US Census data to predict households without indoor plumbing in AK.

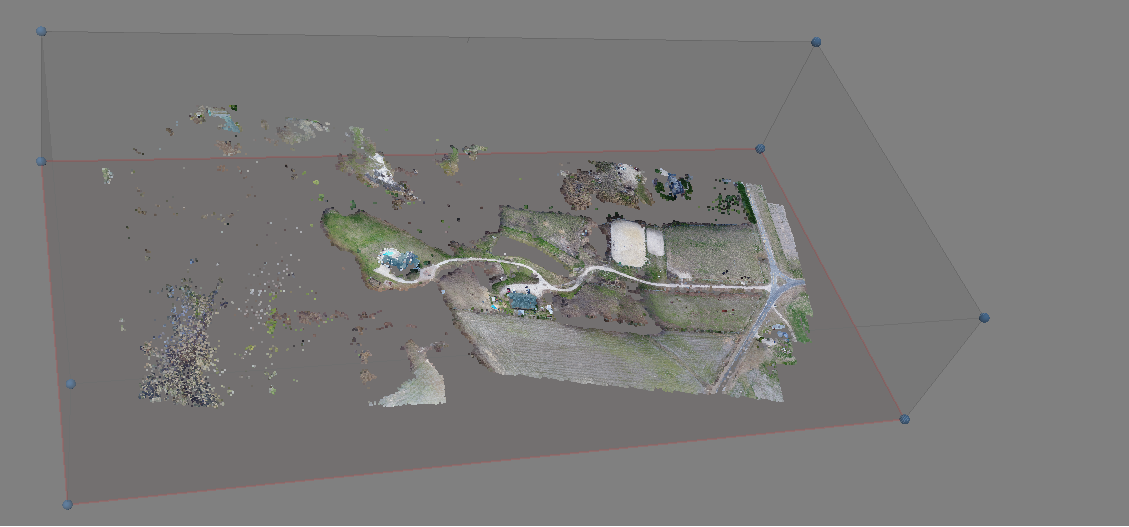
Five Ground Control Points (GCPs) used to create a point cloud from UAS flights over the farm. GCPs are highly accurate geographic locations and improve the accuracy of models created from UAS flights.
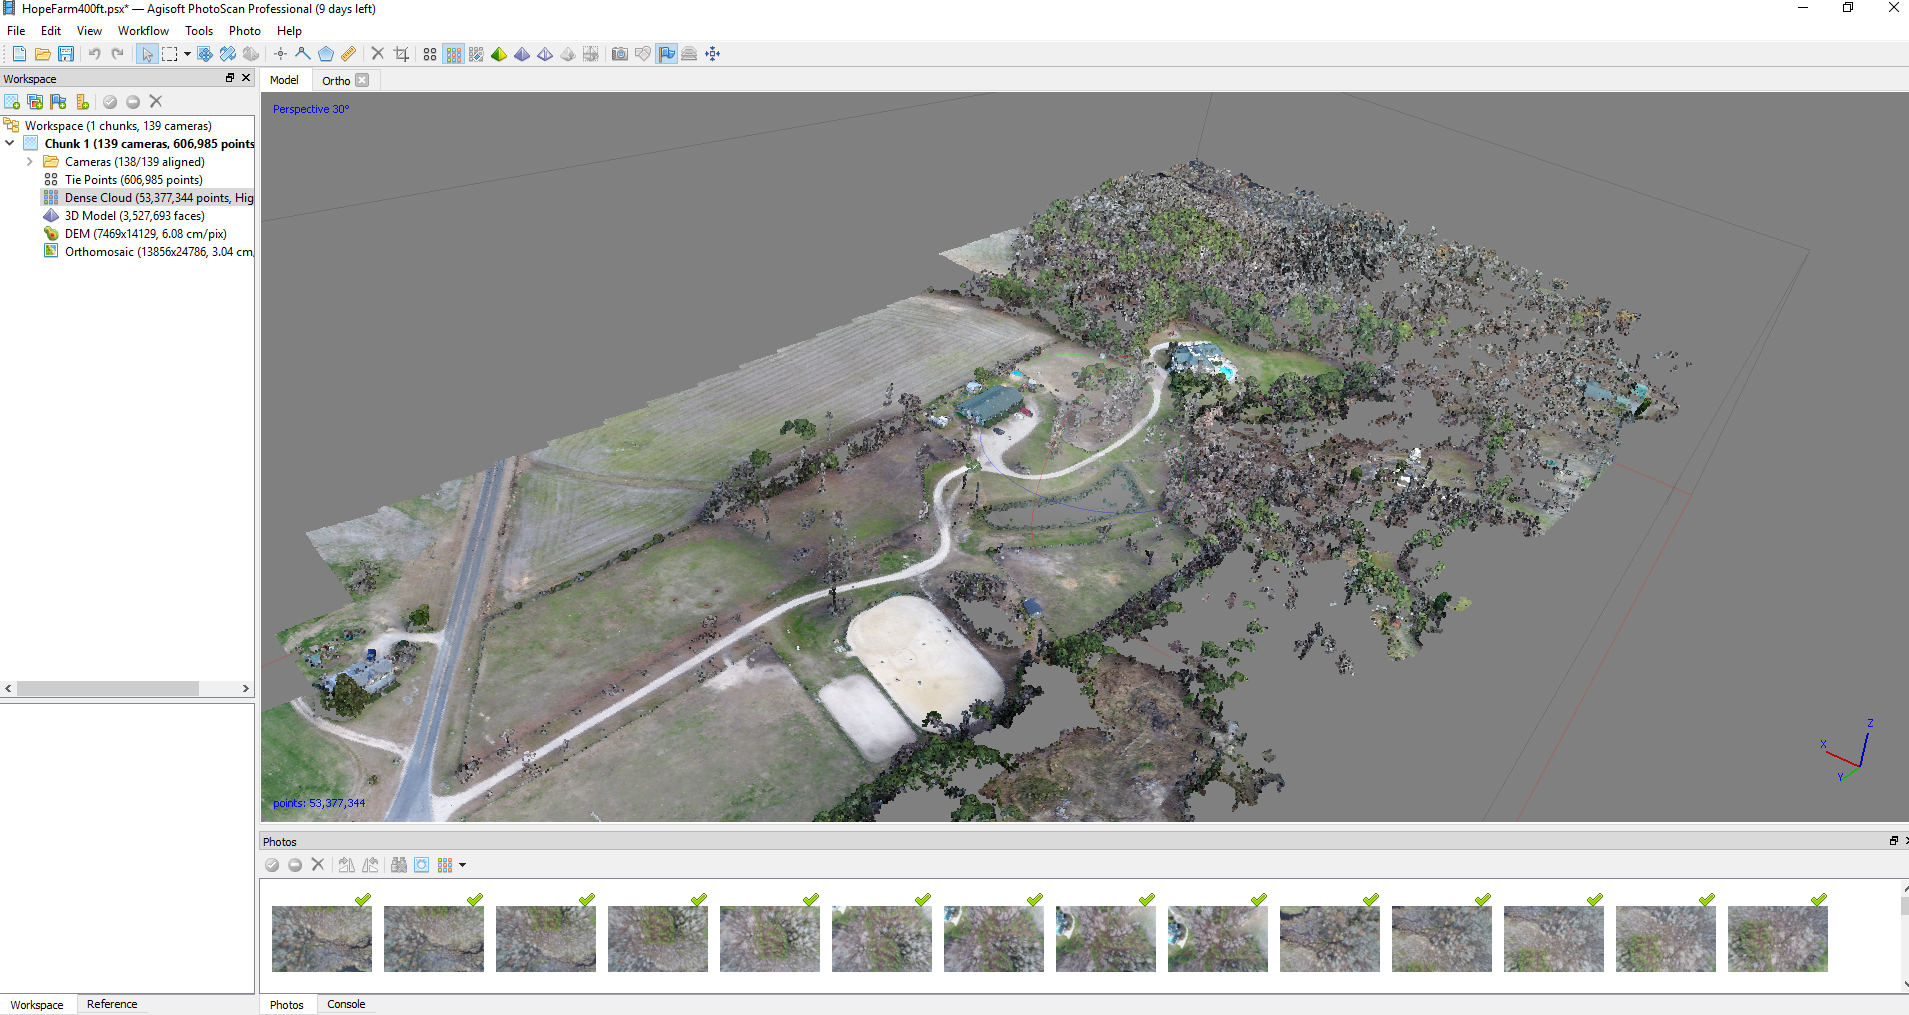
After a UAS flight that has taken multiple overlapping images, you can create a point cloud to use to produce an elevation model. Drones record pitch, yaw, and roll along with velocity and geographic location with each photo taken. All this data can be matched with individual pixels between photos and then geometrically calculated into a point cloud.
Point cloud showing 'tie points' or locations where multiple pixels were able to be matched between UAS images. Notice the areas not covered by forest are easier for the program to match.

After a UAS flight over the farm in 2018, I did a hydrology study across the farm. This map shows individual watersheds in the riding ring and drainage outlets. It helped us in redirecting some of our waterflow issues.

3D view of the riding ring with streamflow shown by the light blue lines.

The red spots show where sinkholes are located in one of the pastures at the farm. This was created from a 200' UAS flight and subsequent DSM (Digital Surface Model) creation.

Difference in elevation (meters) between two UAS flights: one flown at 200' and the other at 400'

Pretty aerial image from one of the UAS flights. One of many that were used to create an orthomosaic (or aerial image with associated geographic information) and digital surface models (DSMs).
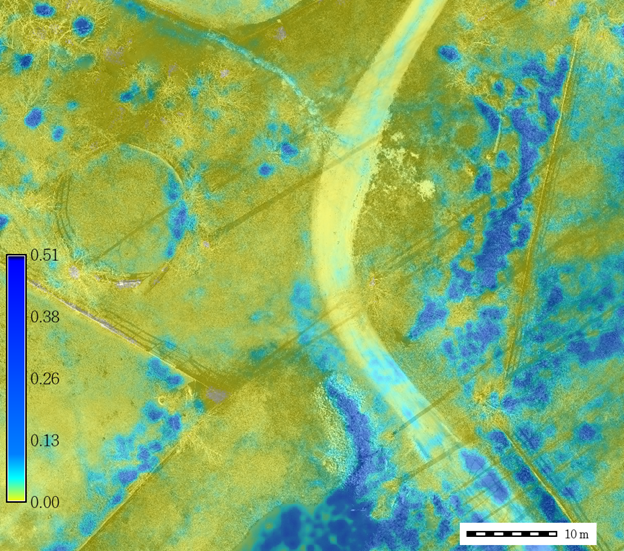
This shows the predicted water depth (inches) after 60 minutes of 1.7 inches of rain per hour. This helped in identifying potential water pooling areas along the driveway. The model used for this was r.sim.water in GRASS GIS. The results compared to the observations were similar. The model slightly overpredicted.

Tracking an unmoored buoy in the Gulf of Mexico.
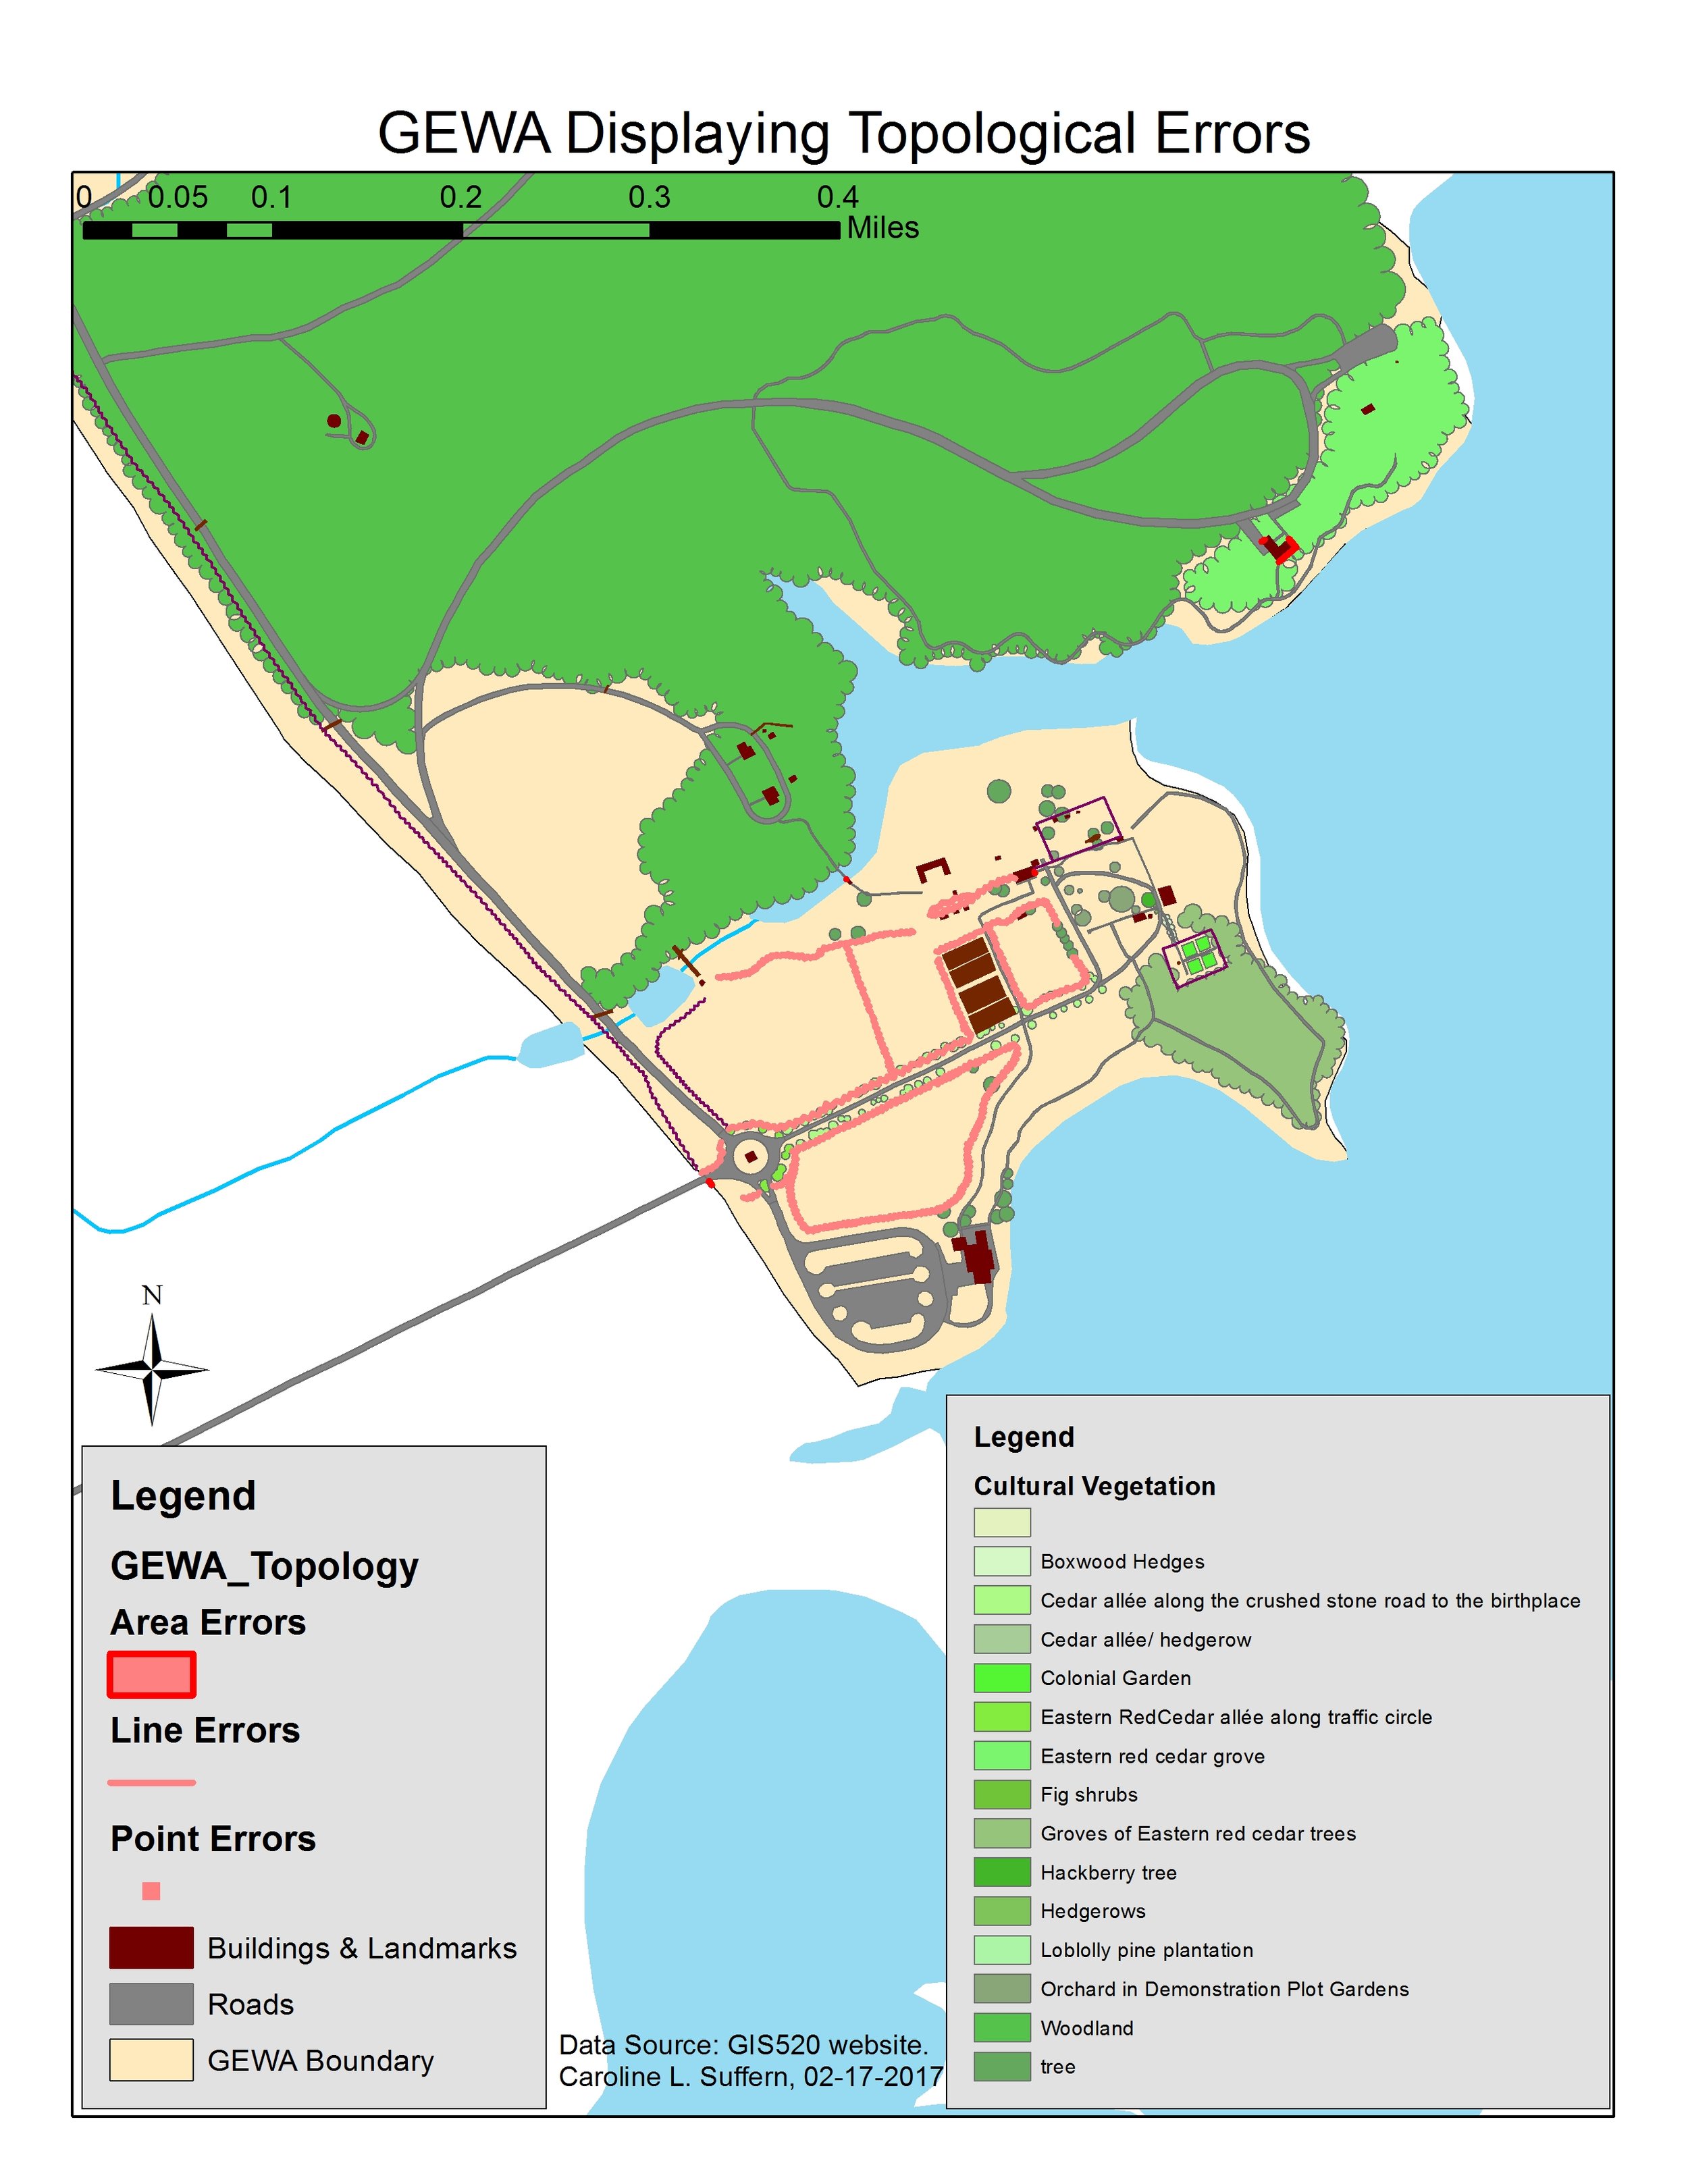
This map shows identification of topological errors in a land use layer for George Washington Birthplace National Monument.

Ketchikan LPI overlaid with identified landslide fields.
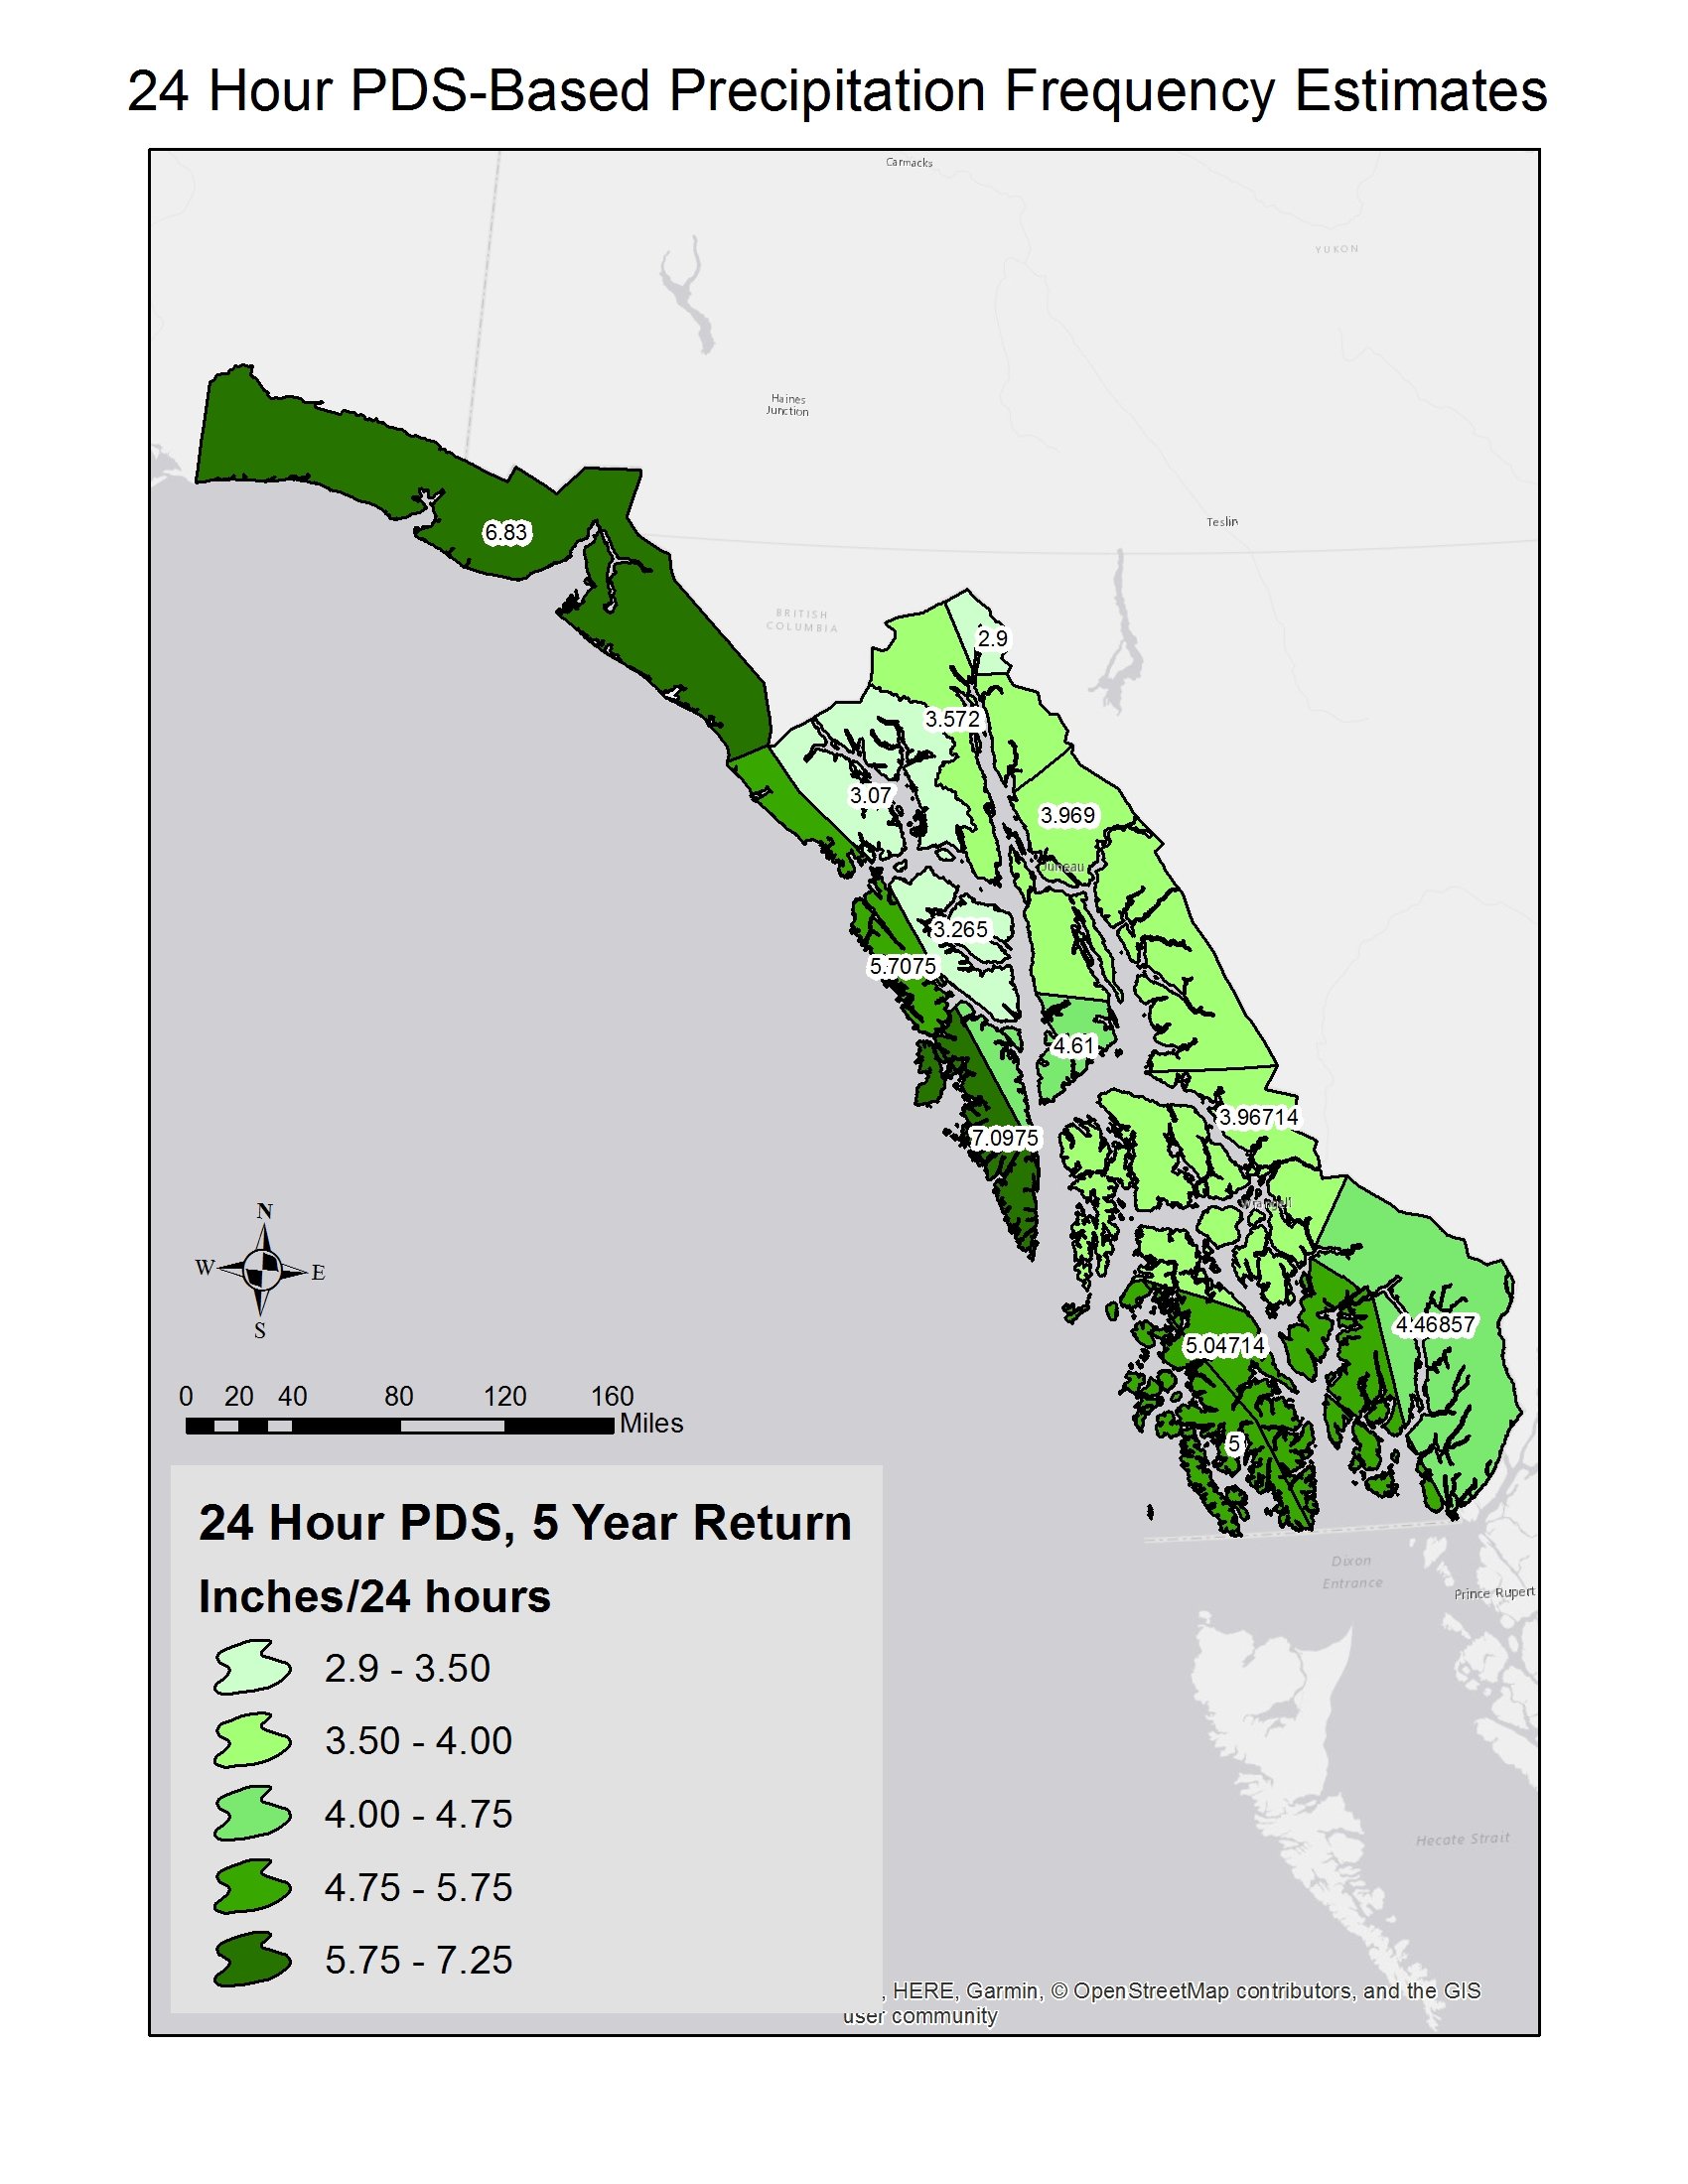
Precipitation estimates for southeast AK used in a landslide study.
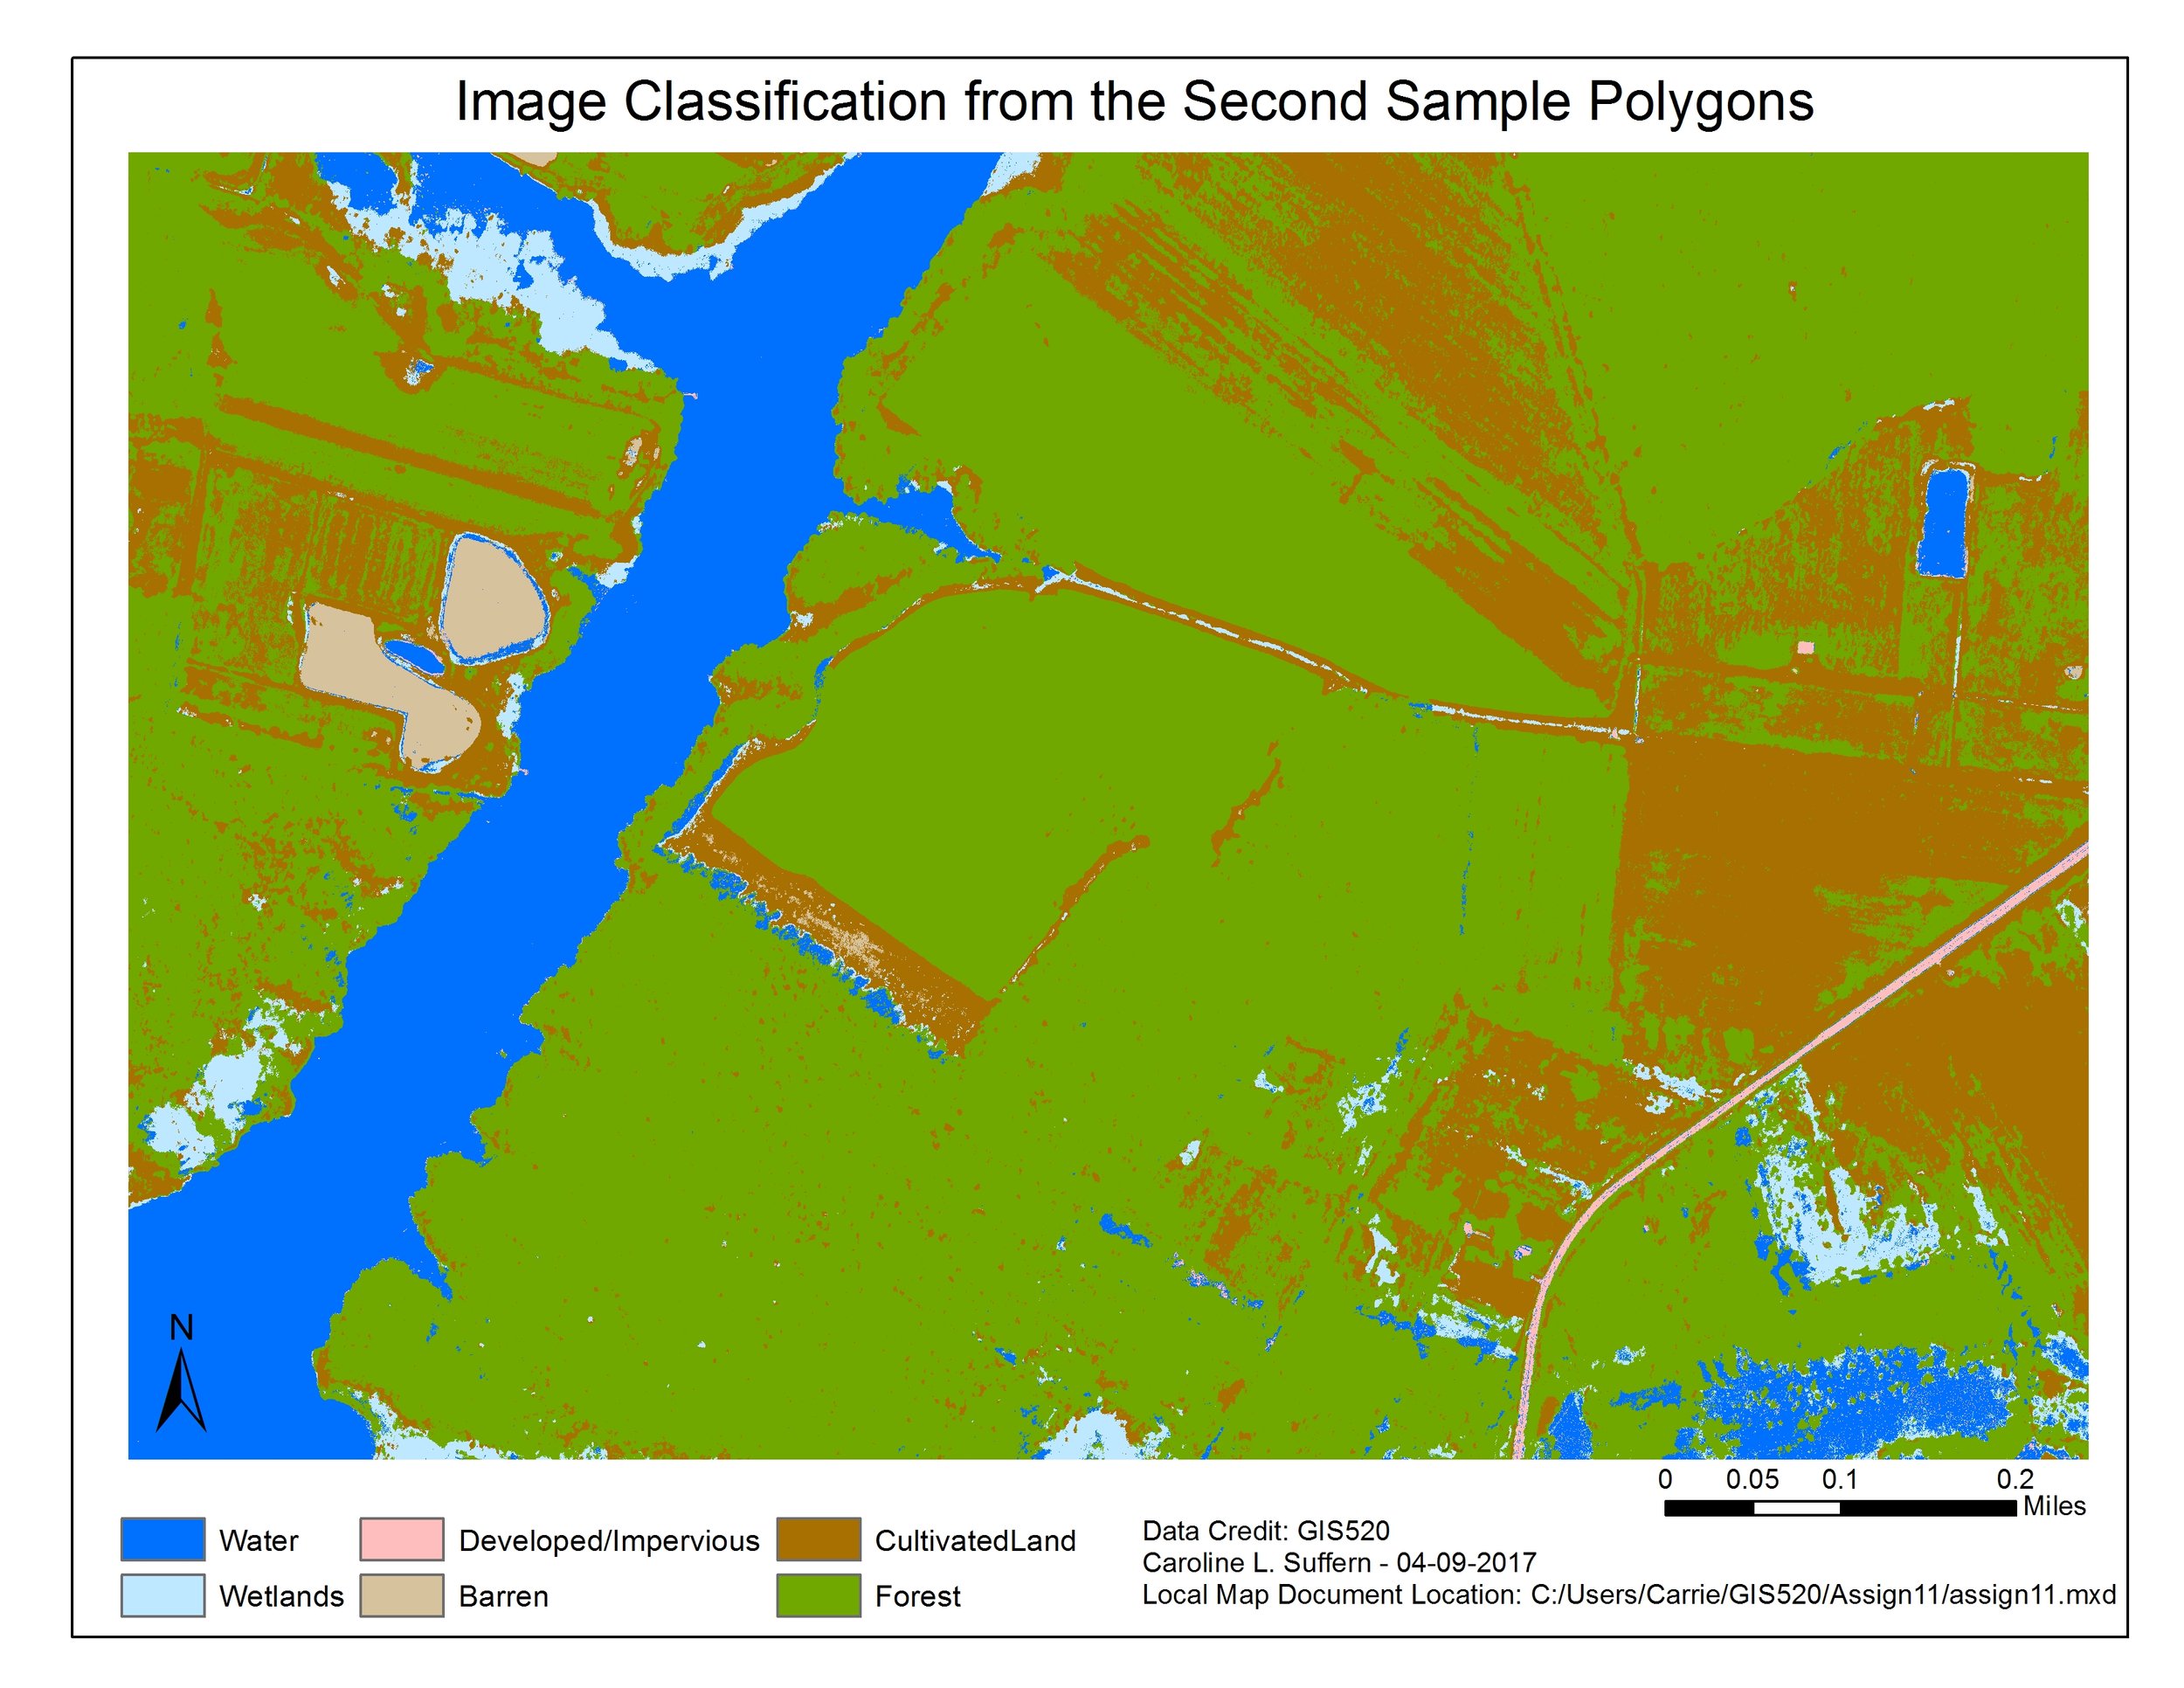
Land use classification from aerial imagery and defined spatial thresholds.
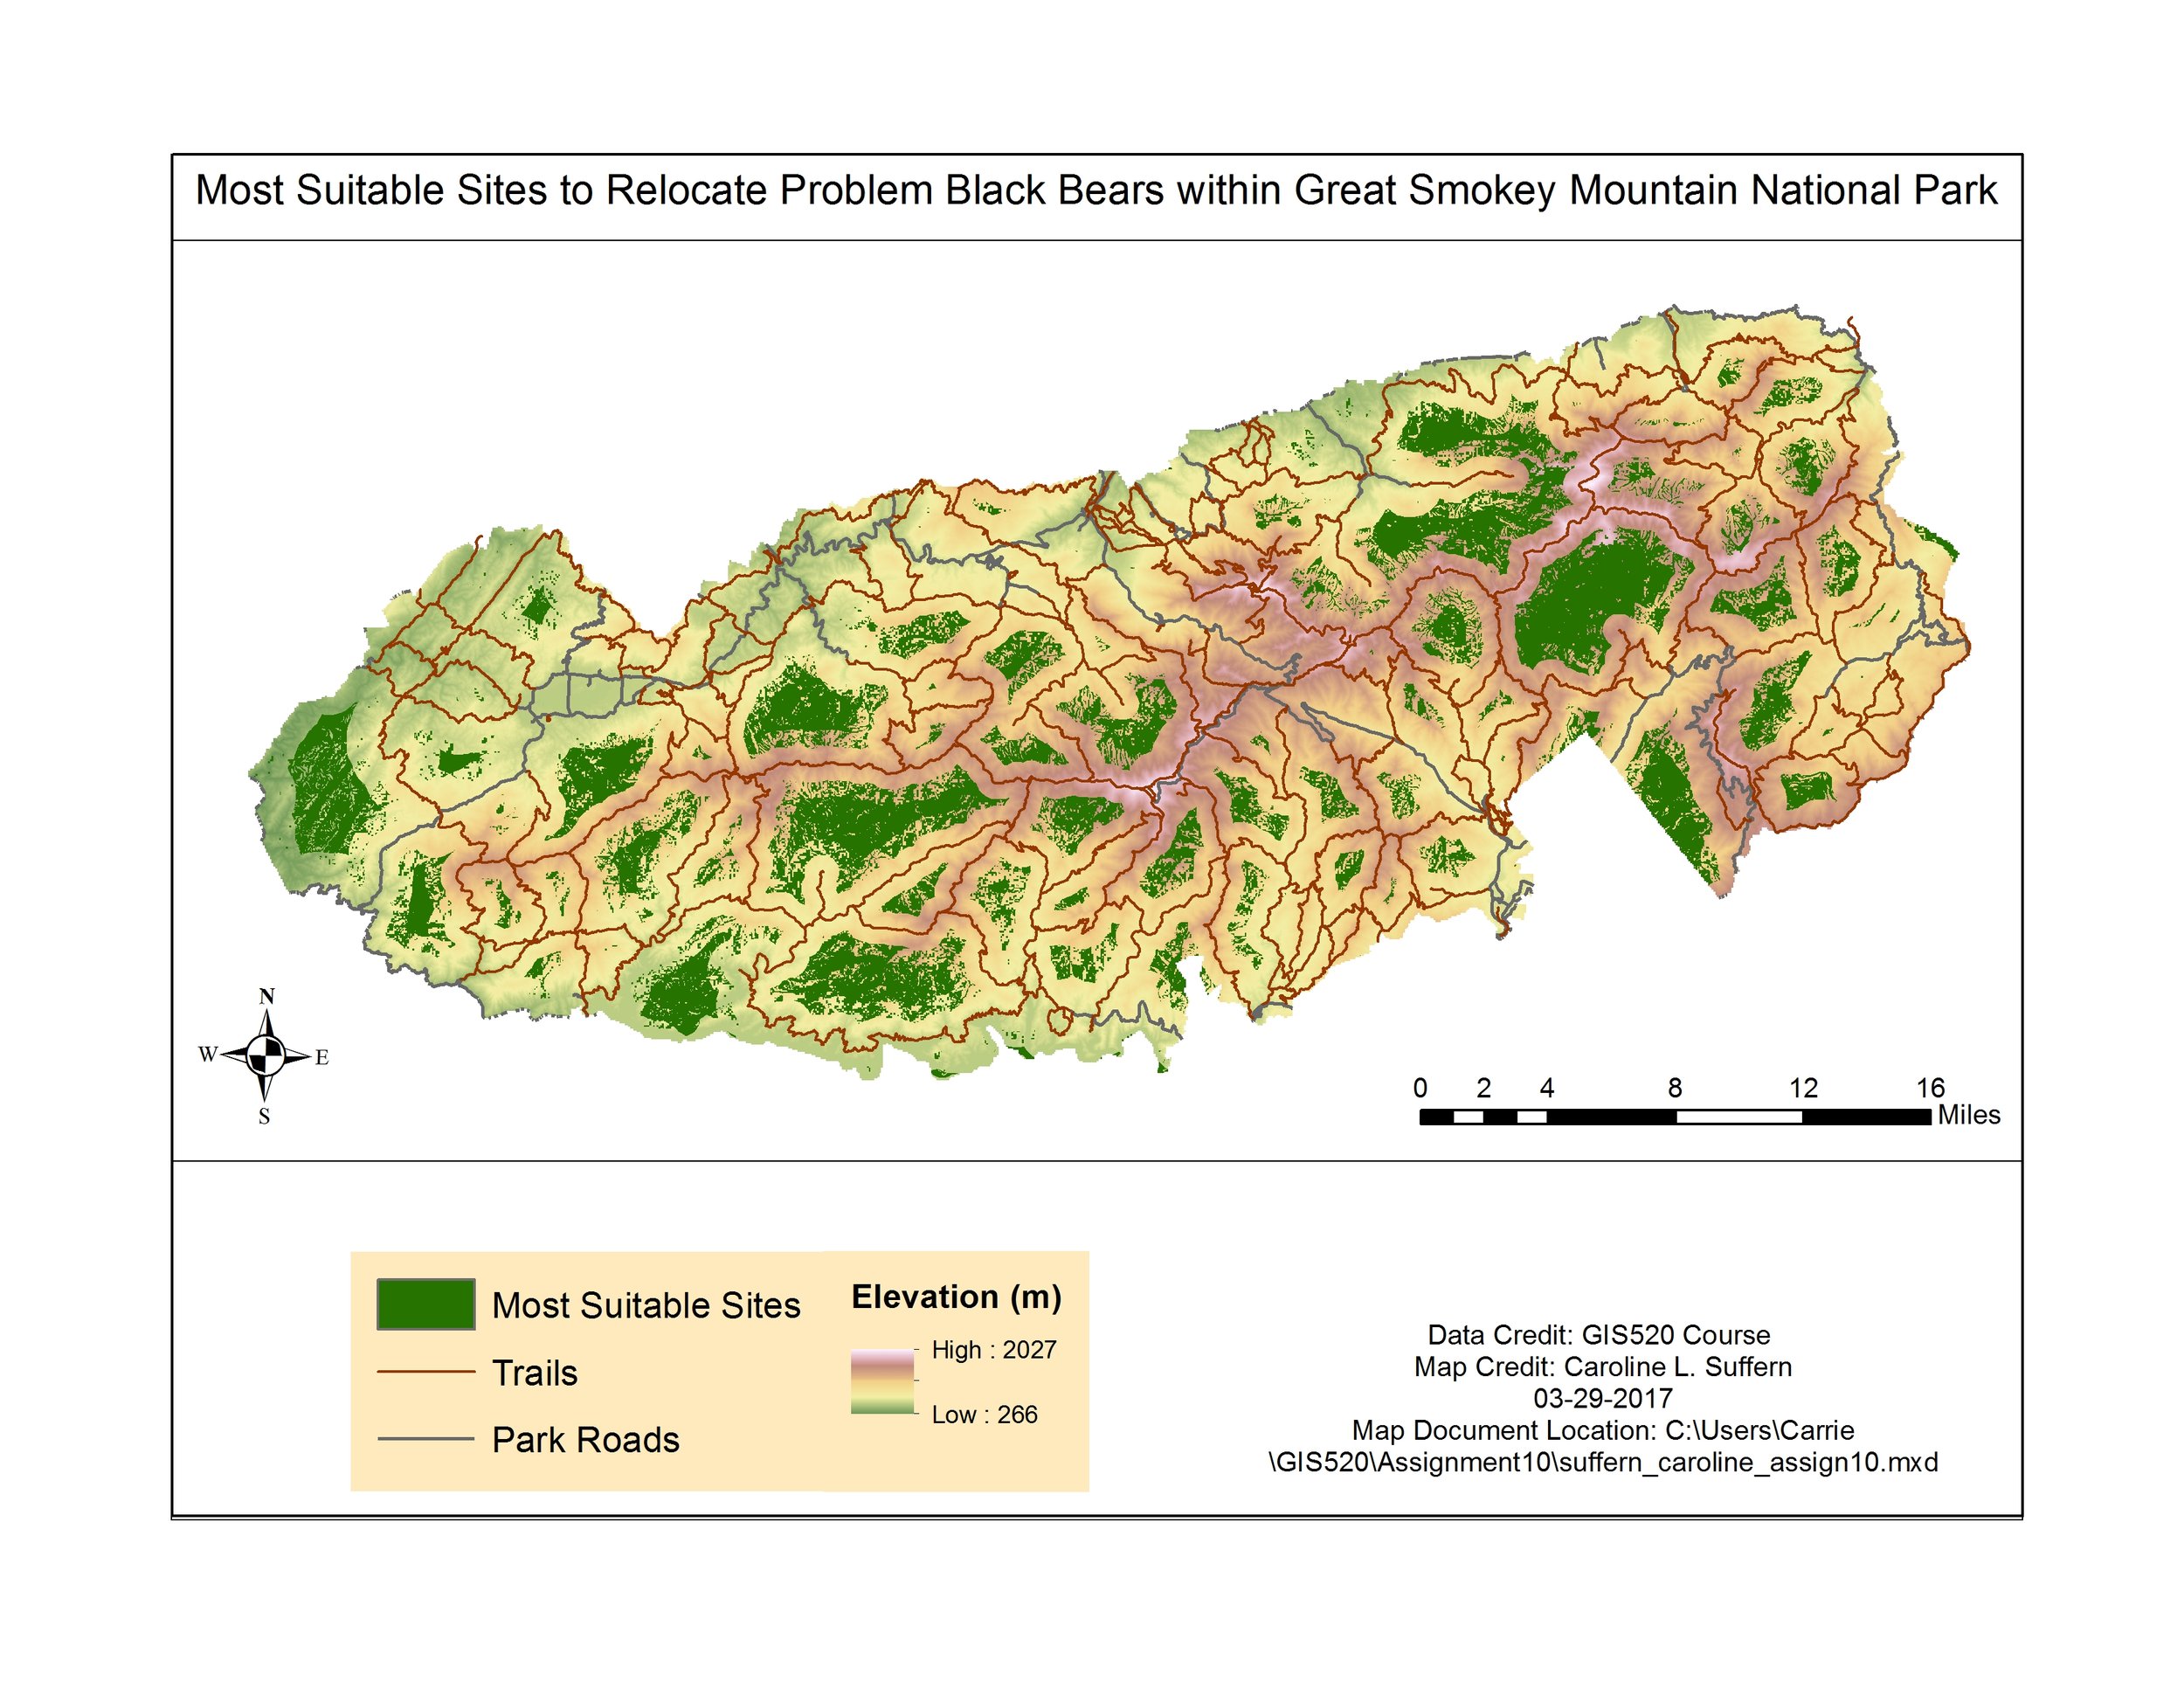
Site suitability for nuisance bear rehoming.